Predicting voter behavior
"Looking for the patterns in static, they start to make sense the longer I’m at it"


I am not a pollster. If you’re a subscriber, you likely already know this, but I feel like it’s a necessary disclaimer amid the many amateur tea leaf readers that the presidential election season manifests. I’m certainly guilty of being one of them. How could you not be, especially this time around, with so very much at stake?
One area where I have made some fairly successful modeled predictions in the past is for the big Major League Baseball awards. Since 2015, first for WTOP, then for Baseball Prospectus, I’ve run an awards prediction model for both leagues’ MVP and Cy Young races. Much like political polls, the model uses a weighted combination of statistics to attempt to predict voter behavior for that year’s races. I’ve adjusted it slightly year to year, to account for apparent trends in voter behavior, as certain factors seem to become more or less significant in decision-making.
I originally created the model because the existing such efforts at major sports outlets were, to be frank, garbage. Over the nine years I’ve been putting mine and my own model’s reputation on the line, it has delivered the correct winner in 27 of the 36 races, good for a 75 percent success rate, including a perfect 8-for-8 the past two years. As we say around these parts, that’s pretty good.
Major League Baseball writers, who are the voters in these races, are a small, but demographically shifting bloc. A mix of young and old, increasingly diverse, they weigh different statistics more and less heavily. The model is built to account for this. However, the voting bloc is also a different group of people within that demographic for each award, each year. The best I can do is make general assumptions about their behavior and adjust after the fact.
Still, there have been some results that clearly call for minor tweaks, especially on the pitching side. Even if you got a result largely correct the last time, there is always room to improve. But sometimes, a more major change happens that forces you to rethink the way your methodology has always worked. Like when a once-in-a-lifetime unicorn threatens to break the entire player evaluation system. Or when multiple once-in-a-lifetime political events happen that change the way people participate in their democracy.
On Saturday night, a single poll dropped that, if it is even remotely more indicative of the state of the presidential election race than the conventionally herded wisdom, portends a result that will shock a whole lot of people on Tuesday. Ann Selzer is a well-regarded pollster who covers the state of Iowa for the Des Moines Register. There are many reasons not to over-consider Iowa as a bellwether for the nation — it’s lily white; it doesn’t have a city with more than a quarter million people; no single state could possibly do that kind of work. But Selzer’s output within that state has been very impressive over the last decade, hitting even more consistently than my MLB model:
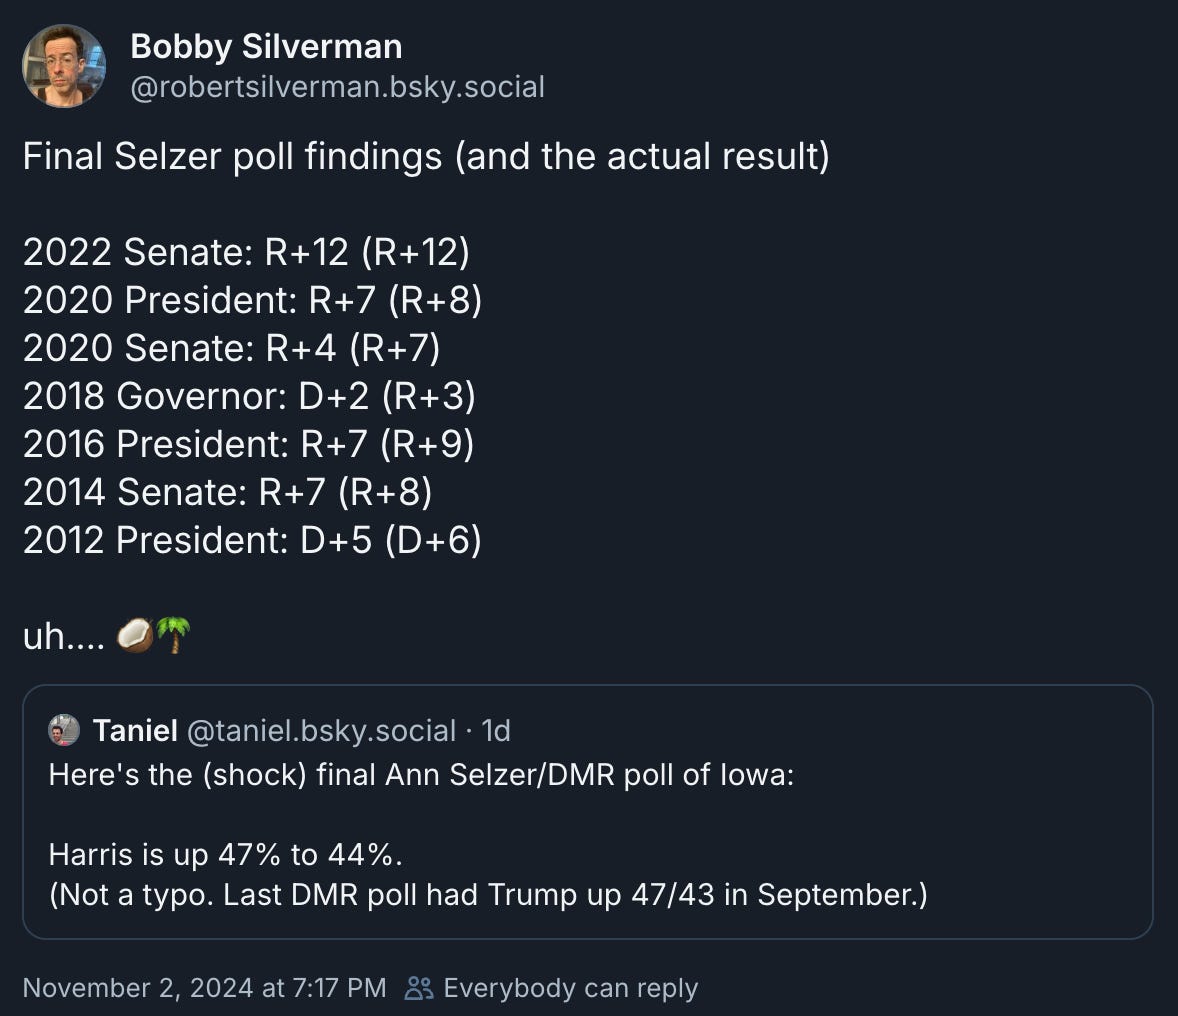
Selzer’s poll over the weekend showed Kamala Harris up three points in Iowa, a state that has trended rightward in recent presidential cycles, and was polling as much as +18 for Trump vs. Joe Biden back in June, before he exited the race. But Iowa’s extremely unpopular six-week abortion ban went into effect over the summer, at which point Trump’s lead over Harris was, according to that same pollster, just four points. Now, this. Still, the popular aggregation models have Iowa in Trump’s camp in the high single digits.
The Selzer result would suggest a broad polling error of perhaps even greater than 10 points, the kind of margin which, if applied across the nation, would not just make Harris the 47th President of the United States, but bring with it a dramatic blue wave. Now, extrapolating one poll to 49 other very different states isn’t very sound. It’s just one piece of information. But Selzer’s methodology — to try to look forward, rather than backward — is crucial, especially given her track record. She shows independent women breaking for Harris by 28 points, up from five points just a few months ago. And if we start to look at some of the information we already know about the 2024 electorate, her conclusions become harder to dismiss.
I always make the biggest changes to my model in the years after their biggest misses. This is only logical — when your prior assumptions are proven wrong, you need to adjust to try to figure out why.
The reaction from political pollsters over the last two presidential election cycles has been to try to desperately not repeat their 2016 miss, in which they undervalued support for Donald Trump. In their persistent efforts to tweak the data, I believe these guys — and, yes, they’re all guys (seemingly all named Nate, but that’s another story), and this feels particularly relevant — have undervalued the key shift currently taking place in the voting bloc: women are extremely motivated to vote.
The Cook Political Report released an interactive map to let the public play with sliders to determine how they think the election will go, broken down by a number of demographic factors: race, education, and voting age range. You can adjust for each of these to see what the different results would be. Almost unbelievably, the one glaring omission? Gender, specifically what all of the rest of the factors would look like if, say, a whole bunch of women who didn’t vote in 2020 showed up in 2024.
So, let’s talk about those women. An NBC News analysis showed more than 100,000 voters who did not vote in 2020 had already cast their ballots in Pennsylvania from October 1-28. For context, that total — before the rest of early voting, not counting mail-in ballots, not counting election day totals — is already equal to 1.5% of the total PA vote in 2020. Those voters were roughly 53% Democratic, 32% Republican, and 15% independent. Just as significantly, in an election where the gender divide between candidate preference is nearly equal, women made up about 56% of that total.
Women have traditionally voted at a higher rate than men, but not that high. From 1978-2022, women made up 52.5% of the electorate, according to the Center for American Women and Politics. Polling that rests on the demographics of the 2020 race and ignores a potential shift in the very makeup of who casts a ballot will necessarily fail to account for perhaps the most significant shift of the intervening years. Let’s look at some more numbers to that effect.
Since Harris replaced Biden on the ticket, women voters who describe themselves as “enthusiastic” went from Republicans +13 (42%-29%) to Democrats +14 (42%-38%). Overall, 64% of women say they are more motivated to vote than four years ago, including 70% of Democrats. The percentage who believe this election will have a major impact on abortion has gone up 11 points since June, from 54-65%, and 11 points among Democratic women, from 71-82%.
To recap: there have been massive shifts in the dynamics of the race since Harris entered it in June, both directly connected to her being the nominee, as well as through outside events that have motivated more women to be active in the race. The shape of the existing female electorate has moved sharply in her direction (in Indiana), while new women voters are outpacing new men voters, with a heavy tilt toward new Democrats (in Pennsylvania). That doesn’t mean we’ll see each of these effects replicated to the same extent in every state. But again — in a race that so many are predicting to be so close, even a fraction of the impact could well be decisive.
I’ll know next week, when I crunch the numbers, who my model will pick for this year’s awards. I don’t expect any big surprises this year, but I also don’t have to deal with a voting set that has shifted, possibly quite dramatically, since the last time I modeled the races. If it had, in some way — if Shohei Ohtani was still actually personally embroiled in a gambling scandal, or if Aaron Judge had been suspended for PED use — I would have to seriously think about how to recalibrate the weights given the new information. To charge forward with blinders on, insisting nothing substantive had happened that might alter the result, would be foolish.
The last time I missed a race was in 2021. I remember looking at the AL Cy Young results and knowing the model had gotten it wrong. I said as much at the time.

It felt wrong to tweak the model, coming off a correct prediction in 2020. But that prediction hid some underlying issues, which I had failed to address in the intervening year. With those adjustments, I haven’t missed a Cy Young in either league since, but I also had time to make the fix I knew I needed to make to be right that year and I didn’t do it.
Maybe the Nates really do believe in their very hedged, anything-can-happen, toss-up predictions. Maybe their persistent fear that polls aren’t reaching enough Republican voters, just as in 2016 and 2020, will prove accurate. Maybe they’ve lived in the increasingly right-wing echo chamber of zombie Twitter for long enough that they’ve lost perspective. Maybe they don’t see why what’s been happening in the years since Roe vs. Wade was overturned matters. Or maybe they do, and they just think it’s too late to adjust now.
Silver, who rates Selzer as one of the best pollsters in the business, said that "If you had to play the odds, this time Selzer will probably be wrong." We don’t have to wonder what she might understand that he doesn’t.
We’ll find out the real score Tuesday.